By TrainingCourseMaterial.com
Reviewed by: TrainingCourseMaterial.com
Fishbone diagrams — also called Cause & Effect diagrams or Ishikawa diagrams — are simple yet powerful tools used in brainstorming and root cause analysis. They help teams visually map out potential causes of a specific problem, especially in quality control or process improvement.
Why Use a Fishbone Diagram?
- Helps identify root causes, not just symptoms
- Encourages team participation and clarity
- Reveals relationships between potential causes
- Guides deeper investigation into recurring issues
How to Create a Fishbone Diagram
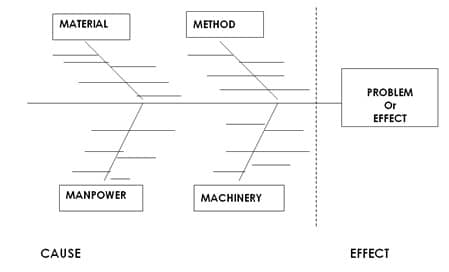
Step 1: Define the Problem or Effect
Start by writing down the specific problem or undesirable outcome. Place this inside a box at the right side of the diagram — this becomes the "head" of the fish.
Step 2: Identify Major Cause Categories
Draw a horizontal line leading into the problem box. Then add four to six angled lines (like fish bones), each labeled with a major cause category. Common ones include:
- Manpower: People involved 👥
- Methods: Procedures or rules 📋
- Machinery: Equipment or tools ⚙️
- Materials: Inputs or supplies 📦
Step 3: Brainstorm Sub-Causes
For each major category, ask: “What could go wrong here?” or “What contributes to the issue from this angle?” Add smaller lines branching from the major causes to list sub-causes.
Tip: Use a large diagram visible to all team members to encourage group participation. If the diagram feels overloaded, revisit and refine the problem statement.
Using the Diagram Effectively
- Encourage diverse perspectives when brainstorming causes
- Circle the most likely or critical causes for deeper analysis
- Draw arrows or links to show relationships between specific causes
Real-World Example
In a call center facing a spike in customer complaints, a manager used a Fishbone Diagram to explore potential causes. Under “Manpower,” high staff turnover was listed. Under “Methods,” inconsistent call scripts were flagged. This visual process helped the team focus on retraining and standardizing scripts — cutting complaints by 40% within two months.
Common Pitfalls to Avoid
- Making the problem statement too broad
- Filling the diagram with vague or assumed causes
- Failing to revisit or act on identified root causes
For more insights, see our related article on Problem Solving and Decision Making.
Train Teams on Visual Problem Solving Tools
Explore our ready-to-deliver Creative Problem Solving & Decision Making training material package — it includes slides, facilitator guides, and worksheets to bring tools like Fishbone Diagrams to life.
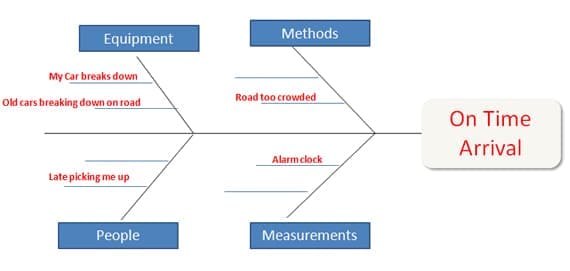
Here is an example to try to analyse and find the cause of a simple problem like arriving to work on time. Notice how we put the "problem" in a box on the Effect side (Right side), then we list all categories and all factors we can think of in the Cause side (Left side) and examin each cause carefully. Its a fact that if you analyse the problem visually using diagrams and you have all possible causes right there infornt of you, the chances are you wiill be able to find out the real cause much easier than just keeping it all in your head.
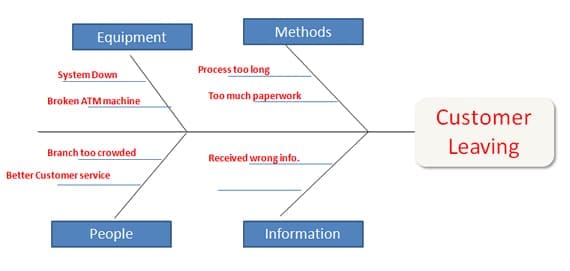
Here is another example for a more complex problem where a bank's senior staff is loosing customers and the senior staff are trying to figure out why
For more creativity and problem solving tools, check out our instant download training package: Creative Problem Solving & Decision Making


39 Full Courses & 6 Mini Courses
Get all available programs
& save ...!!
Price: $4499.95 $2995.95
Great Value For Money
Read More |
+ |  |
The Presenter-Trainer Package®
Train The Trainer
Presenting With Impact
Price: $359.95 $299.95
SAVE $59.95
Read More
Retail Excellence Series®
3 Complete Courseware
Packages in 1
Frontline Retail Selling Skills
Retail Sales Planning & Forecasting
Passionate Retail Experts
Price: $539.855 $349.95
Pay for 2 Get 1 Free
Read More
Sales excellence series®
3 Complete Courseware
Packages in 1
Sales Management
Professional Selling Skills
Sales Territory Planning & Routing
Price: $539.855 $349.95
Pay for 2 Get 1 Free
Read More
Call Center Excellence Series®
4 Complete Courseware
Packages in 1
Handling angry and difficult callers
Call control
Find a way to say YES!
Successful telephone debt collection
Price: $719.95 $449.95
Pay for 2 programs and Get 2 programs Free
Read More
Communication Excellence Series®
4 Complete Courseware
Packages in 1
Communicating with clarity and impact
Negotiating for results
Conflict resolution
Presenting With Impact
Price: $719.95 $449.95
Pay for 2 programs and Get 2 programs Free
Read More
Customer Service Excellence Series®
5 Complete Courseware
Packages in 1
Vision, Energy & Passion To Serve
Pathways to service excellence
Find a way to say YES!
Passionate Retail Experts
Setting others up for success
Price: $899.75 $599.95
Pay for 3 Get 2 Free
Read More
Find Out
Your Leadership
Style

Emotional Intelligence
Through a series of hands-on activities and key emotional intelligence concepts, this one-day training program will help participants improve their emotional intelligence skills enabling them to use emotional information from themselves and others, integrate this with their thinking for better decision making helping them to more easily get what they want from the immediate situation and from life in general.

Find a way to say YES! (Telephone customer service)
This fun high energy two day call center customer service excellence program combines the best in corporate training with the best in personal motivation. Throughout the training program agents discover that it’s truly up to them to make a difference and that each agent is directly responsible for the success of the business.
Front Line retail selling skills
Many retail store sales agents may believe that focusing on sales and achieving sales targets will necessarily affect the level of customer service they provide. However, when retail employees focus on how their customers feel and make decisions throughout the experience, they deliver excellent service and develop valuable two-way RELATIONSHIPS.
Handling angry and difficult callers
It’s no fun being on the receiving end of a frustrated angry shouting caller who just had a bad customer experience and out to get his/her revenge, particularly when the caller’s issue was not even your fault in the first place. This one day program will help you teach call center agents a simple but powerful 3 step process. Using this process.
Influencing People
The sophisticated ability of humans to influence and be influenced by each other is probably one of the key foundations of the evolutionary success of our species. It’s an essential part of human communication and a powerful tool in both the personal and professional lives of people of all sorts. We all need to use the art of influencing others in some aspect of our lives...
Lead, Motivate & Inspire - Leadership Skills Training
The best leaders have the ability to share their vision with passion and commitment, giving their people a purpose, a challenge they are willing to embrace and carry on to achieve amazing results. This two day activity based training program will empower you as a leader in bringing out the best in yourself and others by exploring the most critical success...
Marketing Essentials
This two-day training program aims to help you transition from thinking like a consumer to thinking more like a marketer. It takes a step by step approach to clearly outline the whole marketing process from market research to putting together a marketing strategy and a marketing plan.

Managing Office Politics
In today’s complex and competitive work environment, understanding and effectively navigating office politics is essential for career success. The "Mastering Office Politics" training program is designed to equip professionals with the knowledge and skills needed to thrive in any organizational setting. Through this comprehensive program, participants will explore the dynamics of workplace politics...
Managing People
Packed with fun, hands-on activities, this two-day program will help you teach your class four core management fundamentals that are essential for each new line manager and supervisor. From setting clear objectives to monitoring performance to motivating your team, situational leadership and more...
Managing The Customer Experience
The customer experience has emerged as a critical difference in today's competitive corporate environment. In this practical training workshop, we'll introduce you to the world of customer experience (CX) and provide you the tools you need to manage it successfully. Participants in this hands-on course will acquire the skills necessary to design customer journey maps, a crucial tool for enhancing CX, through a variety of practical exercises.
Negotiating for Results
Negotiating is a part of everyday life. We negotiate in our work, with our friends, and even our family members. In this two day class, participants will learn what negotiation is and how to get the most from their personal negotiations. Participants will discover their personality style and how to negotiate effectively with other personality styles.
New College Instructor Orientation
Making the move from industry to classroom is difficult for many new college instructors. Your day is not your own anymore – each moment is about focusing on the adult learners in your classroom. You may be used to clocking into a 9 to 5 job but teaching in a college is much different: you’ll need to know how to manage your time, prepare lesson plans, develop assignments and tests, and how to evaluate your students.
Administrative Assistant Skills
This two day training program is packed with techniques for improving the most essential basic business writing skills as well as both verbal and non-verbal communication in general in addition to proper time management and general office organization techniques that will help administrative assistants, secretaries and office managers in performing their day to day tasks more confidently and professionally.
Anger Management
We all know an angry face when we see one. Anger is such a universal and powerful emotion that can make you physically and emotionally ill, sap your energy and poison your relationships or it can motivate you to make needed changes and add vitality to your life. This training program aims to help you adopt a more constructive attitude towards your anger and to more effectively manage anger in others as well.
Building High Performing Teams
A highly engaging one-day training program packed with a plethora of fun activities and games focusing on the key characteristics of high performing teams. The high energy training program will help you equip members of a team with the essential skill set and mind set to be a professional team player in a high performing team in which every individual takes responsibility to be productive, proactive and reliable.
Business Etiquette
The ability to handle yourself properly today can sometimes outweigh even your technical skills. If you know what to do, when to do it, and how to do it with grace and style, you’ll have a competitive edge in your career. All business experts agree that good manners promote good business. This is how important business etiquette is.
Call Control
The main focus of this one day tailored training program is to help call center agents reduce their AHT – Average call handling time by equipping them with the required call control and questioning skills needed to effectively control each call more efficiently and help them lead and steer conversations with customers tactfully towards a more...
Coaching People For Better Performance
In this two-day interactive training program, participants will learn a structured process that will enable them to systematically develop their people and unlock their potential to improve their performance. Participants will learn through a series of hands-on activities, and practice two different coaching models (Continuous support coaching model & GROW coaching model)...
Change Matters - Change Management
No matter if you are the boss at your company or an employee, change affects everyone. In dealing with change, people must address their own thoughts, feelings and behaviors first to be able to go through the labyrinth of change. There are loads of books and training programs addressing organizational change. The different thing about this training program...
Communication Skills for Customer Service Staff
The "Communication Skills for Customer Service Staff" training program is designed to assist all front-line customer service staff in enhancing their communication skills in order to provide a positive experience for customers. This program consists of seven modules that cover a variety of communication skills, such as having personal energy and passion...
Communication Skills for Sales Staff
Elevate your sales game with this dynamic training program! Gain the tools and strategies to build rapport, understand customers deeply, forge authentic connections, deliver exceptional service, overcome objections, and confidently close deals. Discover the secrets of tailoring your communication style and uncover persuasive conversations that leave a lasting impact.
Communicating with Clarity and Impact
This energetic training program focuses on the most essential communication skills needed for the challenging and competitive working environment of today. It starts off with a fun exercises that will put the listening skills of your class participants to the test and lay the ground for many of the concepts throughout the program.
Conflict Resolution
Conflict is inevitable, we’ve all had conflict situations in the past and probably will have them in the future. This two day conflict resolution training program will teach you or help you teach others how to more confidently deal with workplace conflict situations. Participants will discover how conflict situations can be turned around into opportunities.
Creative Problem Solving and Decision Making
This highly interactive workshop introduces a variety of creative problem solving and decision making tools and techniques. Participants will learn to analyze problems, generate creative solutions, and decide which solution most closely matches their needs. In addition to the numerous activities and exercises throughout the training where participants get to practice the different tools and techniques learned...
Emotional Intelligence
Through a series of hands-on activities and key emotional intelligence concepts, this one-day training program will help participants improve their emotional intelligence skills enabling them to use emotional information from themselves and others, integrate this with their thinking for better decision making helping them to more easily get what they want from the immediate situation and from life in general.
Find a way to say YES! (Telephone customer service)
This fun high energy two day call center customer service excellence program combines the best in corporate training with the best in personal motivation. Throughout the training program agents discover that it’s truly up to them to make a difference and that each agent is directly responsible for the success of the business.
Front Line retail selling skills
Many retail store sales agents may believe that focusing on sales and achieving sales targets will necessarily affect the level of customer service they provide. However, when retail employees focus on how their customers feel and make decisions throughout the experience, they deliver excellent service and develop valuable two-way RELATIONSHIPS.
Handling angry and difficult callers
It’s no fun being on the receiving end of a frustrated angry shouting caller who just had a bad customer experience and out to get his/her revenge, particularly when the caller’s issue was not even your fault in the first place. This one day program will help you teach call center agents a simple but powerful 3 step process. Using this process.
Influencing People
The sophisticated ability of humans to influence and be influenced by each other is probably one of the key foundations of the evolutionary success of our species. It’s an essential part of human communication and a powerful tool in both the personal and professional lives of people of all sorts. We all need to use the art of influencing others in some aspect of our lives...
Lead, Motivate & Inspire - Leadership Skills Training
The best leaders have the ability to share their vision with passion and commitment, giving their people a purpose, a challenge they are willing to embrace and carry on to achieve amazing results. This two day activity based training program will empower you as a leader in bringing out the best in yourself and others by exploring the most critical success...
Marketing Essentials
This two-day training program aims to help you transition from thinking like a consumer to thinking more like a marketer. It takes a step by step approach to clearly outline the whole marketing process from market research to putting together a marketing strategy and a marketing plan.
Managing Office Politics
In today’s complex and competitive work environment, understanding and effectively navigating office politics is essential for career success. The "Mastering Office Politics" training program is designed to equip professionals with the knowledge and skills needed to thrive in any organizational setting. Through this comprehensive program, participants will explore the dynamics of workplace politics...
Managing People
Packed with fun, hands-on activities, this two-day program will help you teach your class four core management fundamentals that are essential for each new line manager and supervisor. From setting clear objectives to monitoring performance to motivating your team, situational leadership and more...
Managing The Customer Experience
The customer experience has emerged as a critical difference in today's competitive corporate environment. In this practical training workshop, we'll introduce you to the world of customer experience (CX) and provide you the tools you need to manage it successfully. Participants in this hands-on course will acquire the skills necessary to design customer journey maps, a crucial tool for enhancing CX, through a variety of practical exercises.
Negotiating for Results
Negotiating is a part of everyday life. We negotiate in our work, with our friends, and even our family members. In this two day class, participants will learn what negotiation is and how to get the most from their personal negotiations. Participants will discover their personality style and how to negotiate effectively with other personality styles.
New College Instructor Orientation
Making the move from industry to classroom is difficult for many new college instructors. Your day is not your own anymore – each moment is about focusing on the adult learners in your classroom. You may be used to clocking into a 9 to 5 job but teaching in a college is much different: you’ll need to know how to manage your time, prepare lesson plans, develop assignments and tests, and how to evaluate your students.
Administrative Assistant Skills
This two day training program is packed with techniques for improving the most essential basic business writing skills as well as both verbal and non-verbal communication in general in addition to proper time management and general office organization techniques that will help administrative assistants, secretaries and office managers in performing their day to day tasks more confidently and professionally.
Anger Management
We all know an angry face when we see one. Anger is such a universal and powerful emotion that can make you physically and emotionally ill, sap your energy and poison your relationships or it can motivate you to make needed changes and add vitality to your life. This training program aims to help you adopt a more constructive attitude towards your anger and to more effectively manage anger in others as well.
Building High Performing Teams
A highly engaging one-day training program packed with a plethora of fun activities and games focusing on the key characteristics of high performing teams. The high energy training program will help you equip members of a team with the essential skill set and mind set to be a professional team player in a high performing team in which every individual takes responsibility to be productive, proactive and reliable.
Business Etiquette
The ability to handle yourself properly today can sometimes outweigh even your technical skills. If you know what to do, when to do it, and how to do it with grace and style, you’ll have a competitive edge in your career. All business experts agree that good manners promote good business. This is how important business etiquette is.
Call Control
The main focus of this one day tailored training program is to help call center agents reduce their AHT – Average call handling time by equipping them with the required call control and questioning skills needed to effectively control each call more efficiently and help them lead and steer conversations with customers tactfully towards a more...
Coaching People For Better Performance
In this two-day interactive training program, participants will learn a structured process that will enable them to systematically develop their people and unlock their potential to improve their performance. Participants will learn through a series of hands-on activities, and practice two different coaching models (Continuous support coaching model & GROW coaching model)...
Change Matters - Change Management
No matter if you are the boss at your company or an employee, change affects everyone. In dealing with change, people must address their own thoughts, feelings and behaviors first to be able to go through the labyrinth of change. There are loads of books and training programs addressing organizational change. The different thing about this training program...
Communication Skills for Customer Service Staff
The "Communication Skills for Customer Service Staff" training program is designed to assist all front-line customer service staff in enhancing their communication skills in order to provide a positive experience for customers. This program consists of seven modules that cover a variety of communication skills, such as having personal energy and passion...
Communication Skills for Sales Staff
Elevate your sales game with this dynamic training program! Gain the tools and strategies to build rapport, understand customers deeply, forge authentic connections, deliver exceptional service, overcome objections, and confidently close deals. Discover the secrets of tailoring your communication style and uncover persuasive conversations that leave a lasting impact.
Communicating with Clarity and Impact
This energetic training program focuses on the most essential communication skills needed for the challenging and competitive working environment of today. It starts off with a fun exercises that will put the listening skills of your class participants to the test and lay the ground for many of the concepts throughout the program.
Conflict Resolution
Conflict is inevitable, we’ve all had conflict situations in the past and probably will have them in the future. This two day conflict resolution training program will teach you or help you teach others how to more confidently deal with workplace conflict situations. Participants will discover how conflict situations can be turned around into opportunities.
Creative Problem Solving and Decision Making
This highly interactive workshop introduces a variety of creative problem solving and decision making tools and techniques. Participants will learn to analyze problems, generate creative solutions, and decide which solution most closely matches their needs. In addition to the numerous activities and exercises throughout the training where participants get to practice the different tools and techniques learned...

High Impact
Power Point Slide Deck
To support immersive learning, a high impact professionally designed power point slide deck to engage trainees at all levels.

Student
Workbook
A comprehensive reference workbook you can give out to your class participants as a quick future reference.

Trainer
Guide
With step-by-step clear directions with tips and suggestions on what to say and how to present each slide.

Activity
/Exercise Sheets
Various training material and support documents to help you both explain and debrief the different exercises, activities and games Plus a fun final Jeopardy style review game as a fun ending for your training program.

Additional
Support Documents
To ensure you have all you need to deliver a complete and professional training program, additional supporting documents are included with each full course material package. From training evaluation forms to 5 different certificate templates that you can edit and hand out to your participants at the end of your training.

Job Aids
& Forms
Specific forms designed to extend and reinforce the training that participants can utilize back on the job to help them apply the new learned concepts (Select training material packages)